AI Development
AI Car Predictor: How to utilize RPAs to collect data for AI Models
July 14, 2023
AI Car Predictor: How to utilize RPAs to collect data for AI Models
Disclaimer: The information in this blog post is for educational purposes only. It is essential to read the website's terms of service to determine what you can do with the scraped data. Data scraping may be subject to legal restrictions, and laws can vary. It is your responsibility to comply with applicable laws and seek legal counsel if necessary.
In this project we are developing an AI that can predict car prices based on specific car data. While the primary objective of this project is educational in nature, the final product will not have practical applications. Instead, our main focus lies in demonstrating the seamless utilization of Robotic Process Automation (RPA) for web scraping purposes.
The project encompasses several key stages. Firstly, we initiate a data collection phase by selectively querying relevant car brands and subsequently extracting information, such as links and titles, associated with the cars. Following this, we clean and filter the acquired data. Lastly, we proceed to visit the gathered links and extract the required information through scraping techniques. The next step is to train the AI. We start this step by cleaning and transforming the data, after that we train the AI, and lastly create an easy Flask server where we can use the AI model to predict prices.

RPA and Web Scraping
Robotic Process Automation (RPA) is a technology that uses software robots or "bots" to automate repetitive and rule-based tasks typically performed by humans. These bots mimic human interactions with computer systems and applications to perform tasks such as data entry, data extraction, and data manipulation. RPA allows businesses to streamline their operations, increase efficiency, and reduce errors by automating mundane and time-consuming tasks. It frees up human employees to focus on more complex and strategic activities, while the bots handle the repetitive tasks quickly and accurately. The most popular software to develop RPAs with is called UiPath and that is the software we have used in this example.
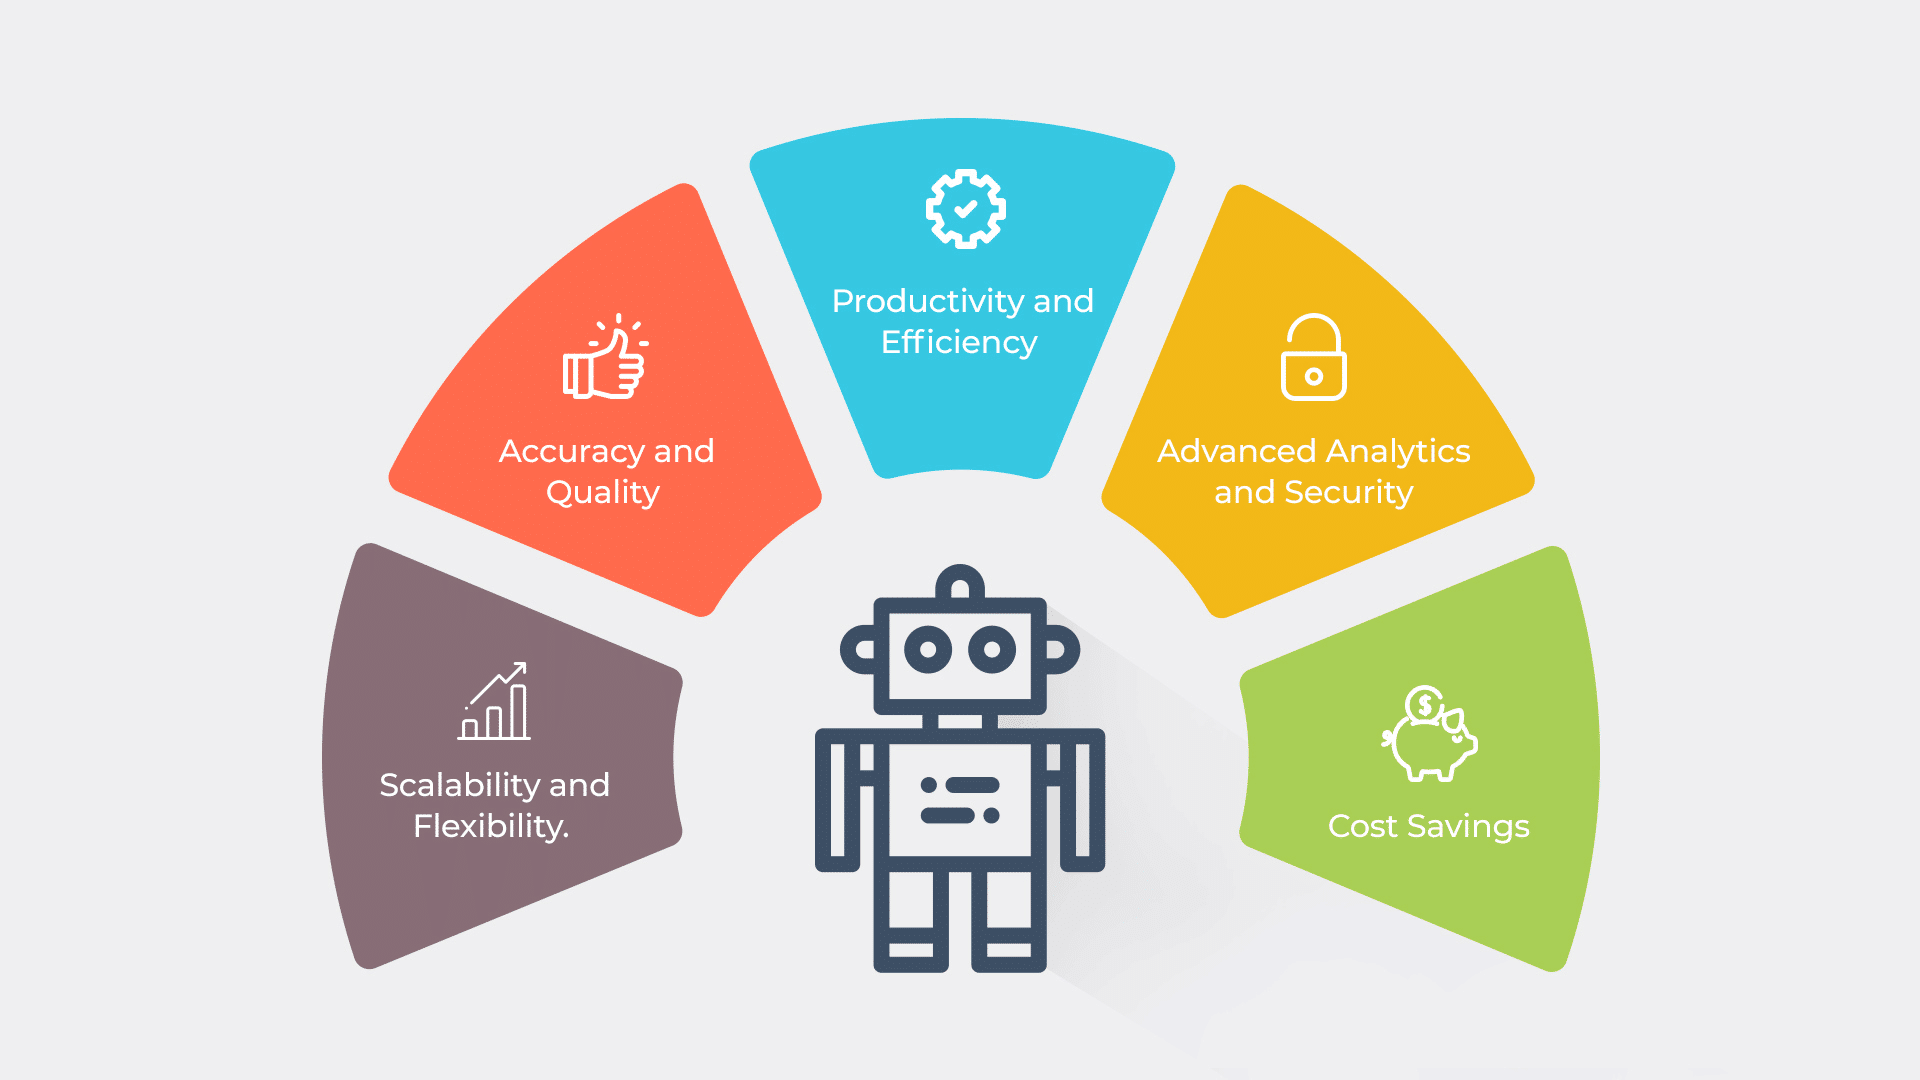
Image Source: ITConvergence
Web scraping is a technique used to extract information from websites. It involves automated software, called web scrapers or spiders, that visit web pages, analyze their content, and extract specific data. Web scraping allows you to gather data from multiple web pages quickly and efficiently, saving time and effort compared to manual data collection.

Image Source: Minelead
Web scraping is commonly done using Python scripts with packages like BeautifulSoup or Scrapy. However, in this case, these methods were not feasible due to the website's complex HTML structure and randomly generated class names. Additionally, the website had a complex robots.txt file, which is used to guide the behavior of web robots and control which parts of the site can be accessed.
Due to these challenges, we opted to use RPAs for web scraping instead. We began by planning the process. We selected the attributes that we believed influenced the price the most, such as brand, model, year, and kilometer driven. To ensure a more accurate model, we focused on collecting data for Volvo and Mercedes-Benz, requiring multiple entries per brand and model. We started by collecting the links of the cars and then proceeded to extract the necessary data from those links.
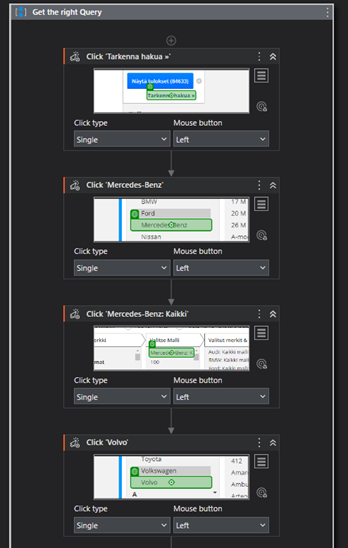
To ensure we obtained results only for the desired car brands, we utilized the "click" activity in UiPath. This activity allows us to specify where on the website the RPA should click. By dragging the click activity into the sequence, we can indicate the target location. In some cases, the UI explorer can be used to edit the selectors, ensuring the program always recognizes the correct button to click on.
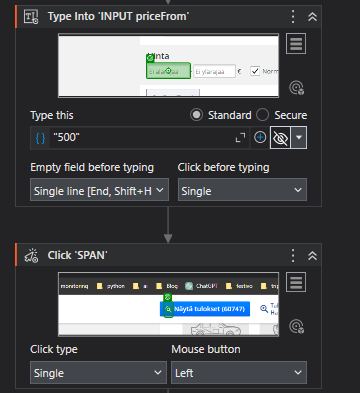
To filter the results, we included a "Type into" event to only retrieve cars with prices over 500 €. This helps us exclude broken cars or listings where the price is not specified but requires bidding.
Next, we utilized the Table Extraction activity in UiPath to easily identify and extract data from the desired table on the website. In this case, our goal was to collect the article names, which consist of the brand followed by the model, along with the corresponding links. Since each page displayed 20 cars, UiPath efficiently captured the required selection within 20 seconds.
To navigate to the next page, we implemented a click event and incorporated an "Append Range Workbook" activity to store the collected data in an Excel file. These activities were enclosed within a while loop to ensure data extraction from multiple pages.
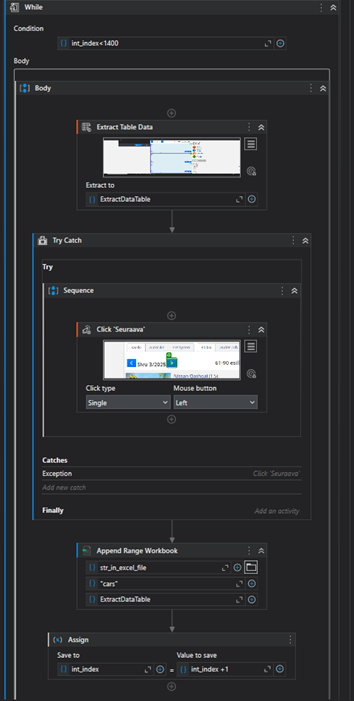
Afterward, we obtained an Excel file containing approximately 7000 rows consisting of titles and links to car advertisements. To ensure the accuracy of the AI model, we needed a substantial number of entries for each car brand and model. Therefore, I applied a data cleaning and filtering script to refine the data. It is also possible to execute this script from UiPath using the Invoke Power Shell activity. By enabling the "IsScript" option in the properties panel and setting the input field to "py (THE PATH TO THE SCRIPT)," UiPath can run the script seamlessly.
import pandas as pd

# Read the Excel file
excel_file = "%Path%/car.xlsx"
df = pd.read_excel(excel_file, sheet_name='cars')

# Remove duplicate rows
df.drop_duplicates(inplace=True)

# Remove ads (rows with missing values in both columns)
df = df.dropna()

# GET THE MODEL FROM THE "TITLE" AND FIX THE COLUMNS
# Split the first column and create new columns
df['Brand'] = df.iloc[:, 0].str.split().str[0]
df['Model'] = df.iloc[:, 0].str.split().str[1:].str.join(' ')

# Remove the original first column
df.drop(df.columns[0], axis=1, inplace=True)

# Fix the link column, put it in last place and add "Link" as header
df = df[df.columns[1:].tolist() + [df.columns[0]]]
df.rename(columns={df.columns[-1]: "link"}, inplace=True)

# Group the models and count occurrences
model_counts = df['Model'].value_counts()

# Filter the dataframe based on model counts
df_filtered = df[df['Model'].isin(model_counts[model_counts >= 150].index)]

# Check how many from each brand
model_counts = df_filtered['Brand'].value_counts()
print(model_counts)

# Save the filtered data to a new Excel file
output_file = "%Path%/car_filtered.xlsx"
df_filtered.to_excel(output_file, index=False)
Then we had an excel file with 4382 entries that looked like this:

The next step involved visiting each link in the Excel file and gathering the required data. We employed the "Use Excel File" activity to access the cleaned Excel file. Subsequently, the "Open Browser" activity was used to interact with the web browser. Additionally, we utilized a "For Each Excel Row" activity to iterate through each link in the Excel file.
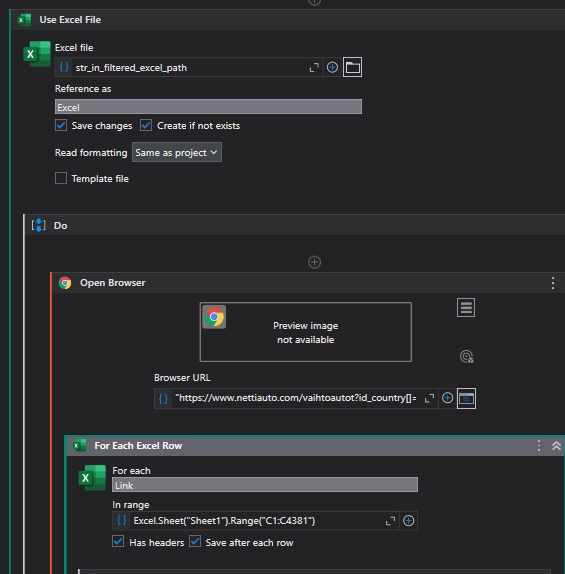
To optimize time efficiency while visiting 4381 links, we employed a different approach. Instead of opening a new browser window or session for each link, we directly entered the link into the Google search field. Since it's the same website, there is no need to reload everything. Following that, we utilized the "Get Text" activity to extract the Year, Km, and Price information from the webpage.
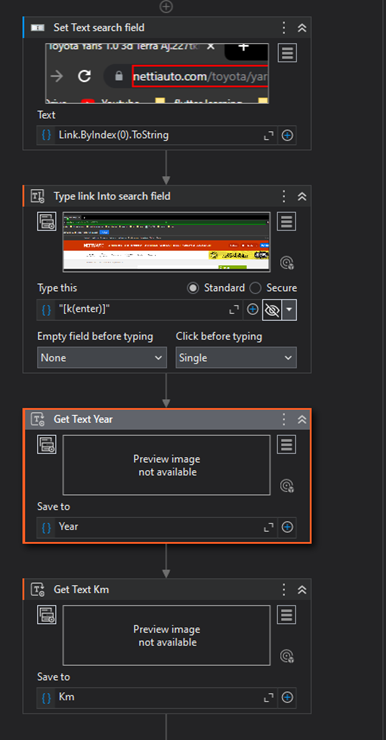
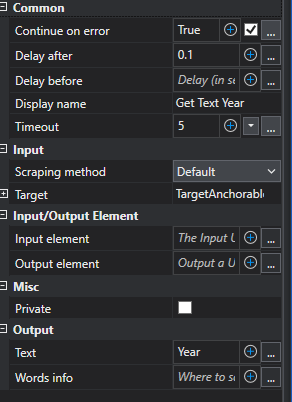
To further optimize time, we made modifications to the properties of the "Get Text" activity. We set the "Continue on Error" property to "True." This allows the process to continue instead of halting completely and producing an error, when the price or any otherattributes are invisible. Additionally, we adjusted the "Delay After" property to 0.1 seconds instead of the original 0.3 seconds. Since this activity does not affect the browser, this change helps save time. Moreover, we reduced the "Timeout" property to 5 seconds from the original 30 seconds. Timeout refers to the duration to wait for the operation to execute before generating an error. Previously, the activity would wait for 30 seconds before throwing an error if there was no price, kilometer, or year information. However, we shortened it to 5 seconds for improved efficiency.
Then after we got the text for the Year, Km and price we check that we got all the values with this expression:
IsNothing(Year) Or IsNothing(Km) or IsNothing(Price)
When all the required values (Year, Km, and Price) are available, we construct a data table and store the respective values within it. Subsequently, we utilize the "Append Range" activity to insert the collected data into a new Excel file. However, if any of the values (Year, Km, or Price) are missing, we skip the current link and proceed to the next one.
After approximately 18 hours, the process completes, resulting in an Excel file containing roughly 3500 rows of car data.
AI cleaning, transforming and training
Now that we have the data, our next step is to clean and transform it to ensure that the AI can properly understand and analyze it. The collected data may contain various text and other elements that the AI may not comprehend or appropriately evaluate. Therefore, cleaning and transforming the data is crucial to prepare it in a format that the AI can effectively process and interpret.

Therefore, we start with cleaning the data. Cleaning involves preparing and organizing the data to ensure its suitability for analysis by an AI model. It entails eliminating any errors, inconsistencies, or irrelevant information present in the dataset. For instance, if training an AI model to recognize images of cats, the cleaning process may involve discarding images that do not depict cats or correcting any mislabeled images. In our case, we focused on removing unnecessary text and numbers from the Year, Km, and price fields. The following script was utilized for this purpose:
import pandas as pd

# Read the Excel file, Put your own path here!
excel_file = "%PATH%/carC.xlsx"

# Add headers to the dataframe
df = pd.read_excel(excel_file, sheet_name='Details', names=['Link', 'Year', 'Km', 'Brand', 'Price', 'Model'])

def make_year_only_numbers(df):
    df['Year'] = df['Year'].astype(str).str[:4]
    return df

def make_km_only_numbers(df):
    df['Km'] = df['Km'].str.replace(r'\D', '')
    df = df[df['Km'] != '']
    return df

def price_only_numbers(df):
    df['Price'] = df['Price'].str.replace(r'\D', '')
    df = df[df['Price'] != '']
    return df

# Clean the data
df = make_year_only_numbers(df)
df = make_km_only_numbers(df)
df = price_only_numbers(df)

# Remove link column
del df['Link']

# Move price column to last
price_column = df.pop('Price')
df['Price'] = price_column

print(df)

# Save the  data to a new Excel file, Put your own path here!
output_file = "%PATH%/car_cleaned.xlsx"
df.to_excel(output_file,sheet_name="Data", index=False)
After this the data looked like this:
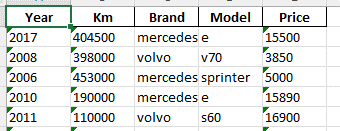
This is a significant improvement. However, to enable the AI to appropriately evaluate the brand and model variables, we still need to transform the data. Transformation involves converting the cleaned data into a format that can be effectively utilized by an AI model. This process may entail various operations such as scaling, normalization, or encoding categorical variables. The objective is to represent the data in a manner that captures essential patterns and relationships, thereby facilitating the AI model's learning and prediction capabilities.
In our case, we needed to transform the categorical variables into dummy variables. For example, we added columns to the Excel file for Volvo and Mercedes. If a car is a Volvo, it is assigned a value of 1 in the Volvo column; otherwise, it receives a value of 0. We applied the same approach to the car models. Here is the script that was utilized for this transformation:
# Imports
import pandas as pd
from sklearn.preprocessing import PolynomialFeatures
import numpy as np

# transform a value to log 1 plus of it
def _get_log1p(val):
    log_val = np.log1p(val)
    return log_val

# Read the raw data, transform the features, and save it as a new excel file
def prepare():
    # read the data
    input_file = "C:/Users/timte/OneDrive/Dokument/UiPath/car_cleaned.xlsx"
    df = pd.read_excel(input_file, sheet_name="Data")
    # Get the dummy varables for the categorical column 'Brand'. Dummy variables are binary variables (can be 0 or 1). They are each assigned to one category of car, one of them would be 1, and the rest 0
    df_cat = pd.get_dummies(df["Brand"])
    # Add the dummy variabes to the dataframe
    df = pd.concat([df, df_cat], axis = 1)
    # Drop the 'Brand' column.
    df = df.drop('Brand', axis=1)

    # Get the dummy varables for the categorical column 'Model'. Dummy variables are binary variables (can be 0 or 1). They are each assigned to one category of car, one of them would be 1, and the rest 0
    df_cat = pd.get_dummies(df["Model"])
    # Add the dummy variabes to the dataframe
    df = pd.concat([df, df_cat], axis = 1)
    # Drop the 'Make' column.
    df = df.drop('Model', axis=1)

    print(df)

    # define a new dataframe called df_features. It should be equal to the df, but without the target (price)
    df_features= df.drop("Price",1)
    # for each column of df_features, create a new column for the log 1 plus transfomed variable
    for col in df_features.columns:
        # Use .apply() method of the column (df[col]), and give it the function defined above (_get_log1p). With that, create a new column in df and call it log1p_{the column name}
        df[f"log1p_{col}"] = df[col].apply(_get_log1p)
    # Define an instance of PolynomialFeatures from the package sklearn
    pn = PolynomialFeatures(2, include_bias=False)
    # Create transfomed data using PolynomialFeatures instance
    trans_data = pn.fit_transform(df_features)
    # Use the trans_data to create a new pandas dataframe
    df_trans = pd.DataFrame(data=trans_data, columns=pn.get_feature_names_out(df_features.columns))
    # get the column price back to it
    df_trans["Price"] = df["Price"]
    # redefine and replace df with df_trans
    df = df_trans
    # save the new df
    excel_file_output = "C:/Users/timte/OneDrive/Dokument/UiPath/carTransform.xlsx"
    df.to_excel(excel_file_output, index = False)

prepare()
In addition to creating dummy variables for Brand and Model, the code also performs other transformations to improve data representation and enhance the AI model's ability to capture complex relationships. It takes the logarithm of each variable, generates new columns, and combines existing features using polynomial functions. A newdataframe is then created with the transformed data.
Now we can proceed to train the AI model. When training an AI model, it's crucial to select the appropriate algorithm or model architecture based on factors such as data type, task requirements, and available resources. Tuning hyperparameters, such as learning rate or regularization strength, is also essential for optimal performance during training. The process involves feeding the transformed data into the model, iteratively adjusting its internal parameters, and evaluating performance against labeled data.
Initially, the CatBoostRegressor algorithm was trained using GridSearchCV to find the best parameters. It took approximately 20 minutes to train and achieved an R2 test score of 0.929. However, upon testing the model on real cars, the results were not satisfactory. Consequently, a simpler approach was pursued using the RandomForestRegressor algorithm. This model took under 1 minute to train and yielded an improved R2 test score of 0.94. Here are some websites where you can read more about R2 score, CatBoostRegressor and RandomForestRegressor.
This is the script that I used; keep in mind I used the RandomForestRegessor for the AI model so you can ignore the function train1 if you are not interested to see how you can use GridSearchCV and CatBoostRegressor.
from os import path
import pandas as pd
from sklearn.model_selection import train_test_split, cross_val_score
from catboost import CatBoostRegressor
from sklearn.metrics import r2_score
from sklearn.model_selection import GridSearchCV
from sklearn.ensemble import RandomForestRegressor
import pickle
import numpy as np

# paths, put your own paths here
paths = {
    "prepared": "%PATH%/carTransform.xlsx",
    "model": path.join(path.dirname(__file__),"trained.model"),
}

def train1():
    # read and prepare data
    df = pd.read_excel(paths["prepared"])
    X = df.drop('Price', axis=1)
    y = df["Price"]
    X_train, X_test, y_train, y_test = train_test_split(X, y, test_size=0.2, random_state=5)
    #
    rfmodel1 = CatBoostRegressor(loss_function='RMSE')
    #
    grid = {'iterations': [500,1000,2000],
        'depth': [5,6,7,8],
        'l2_leaf_reg': [3,5,7],
        'learning_rate' : [0.03, 0.1]}
    #
    model = GridSearchCV(estimator=rfmodel1, param_grid= grid, scoring= "r2")
    model.fit(X_train, y_train)
    # print the best score and best params of the grid search
    print(model.best_score_)
    print(model.best_params_)
    # train model
    #
    rfmodel2 = CatBoostRegressor(**model.best_params_)
    rfmodel2.fit(X_train,y_train, eval_set=(X_test, y_test))
    perf_all_cross_validation = cross_val_score(rfmodel2, X, y, cv=5, scoring='r2')
    # get the mean, that would be the average performance. return the value
    perf = perf_all_cross_validation.mean()
    print('Cross validation score: '+ str(perf))

    y_pred = rfmodel2.predict(X_test)
    # Get r2_score using y_test and y_pred, and print it.
    print('R2 Score: ',r2_score(y_test, y_pred))
    #save the trained model, so that there won't be a need for re training the model everythime there is a request for price. Note wb+ (b is for binary)
    with open(paths["model"],"wb+") as f:
        pickle.dump(rfmodel2,f)
    print("model saved")

def train():
     # read and prepare data
    df = pd.read_excel(paths["prepared"])
    # The dataframe without price
    X = df.drop('Price', axis=1)
    # Just the price column
    y = df["Price"]
    # Split the data into train and test data with a 1/5 split aka 20%
    X_train, X_test, y_train, y_test = train_test_split(X, y, test_size=0.2, random_state=5)
    # train model
    model = RandomForestRegressor(n_estimators=1000)
    # Fit the model
    model.fit(X_train,y_train)
    # Check to see what the R2 test score is
    y_pred = model.predict(X_test)
    #pring the test score
    print(f"The R2 test score is: {r2_score(y_test, y_pred)}")
    #save the trained model, so that there won't be a need for re training the model everythime there is a request for price. Note wb+ (b is for binary)
    with open(paths["model"],"wb+") as f:
        pickle.dump(model,f)
    print("model saved")

train()
Now we have trained the AI model and it’s saved as a pickle file as trained.model
Once we have the trained model, the next step is to utilize it effectively. While a simple program in the terminal is an option, we opted for a user-friendly approach using a server and a straightforward Flask website. Alternatively, one could create a server and connect it to a React app or a mobile app. However, in this blog post, I will solely demonstrate the implementation with Flask. Here you can read more about creating Flask Servers.
First, we made a server and HTML template for the Flask server.
Here is the script:
app = Flask(__name__)

@app.route('/', methods=['POST','GET'])
def home():
    brands = ['mercedes-benz', 'volvo']
    modelsMercedes = ["a", "c", "e", "glc", "sprinter", "vito"]
    modelsVolvo = ["s60", "v60", "v70", "v90", "xc40", "xc60"]

    selected_brand = request.args.get('brands', 'volvo')
    selected_model = request.args.get('models', modelsVolvo[0])
    year = request.args.get('year', '')
    km = request.args.get('km', '')

    if selected_brand == 'mercedes-benz':
        models = modelsMercedes
    else:
        models = modelsVolvo

    selected_model = request.args.get('models', models[0])

    # Print form data in the console
    print("Brand:", selected_brand)
    print("Model:", selected_model)
    print("Year:", year)
    print("Km driven:", km)

    price = 0
    # If both year and Km is something then calculate the price
    if year != '' and km != '':
        price = get_price({"Brand": selected_brand,"Model": selected_model , "Year": year, "Km": km})


    return render_template('index.html', brands=brands, models=models, selected_brand=selected_brand, selected_model=selected_model, price=price)

if __name__ == "__main__":
    app.run()
Here is the Index.html file inside templates folder:
<!DOCTYPE html>
<html lang="en">
<head>
    <meta charset="UTF-8">
    <title>Ai price guesser</title>
</head>
<body>
<h2>Ai Car price guesser</h2>
<form method="GET" action="/" id="carForm">
    <select name="brands" id="brandSelect">
        {% for brand in brands %}
            <option value="{{brand}}" {% if brand == selected_brand %}selected{% endif %}>{{brand}}</option>
        {% endfor %}
    </select>
    <select name="models" id="modelSelect">
        {% for model in models %}
            <option value="{{model}}" {% if model == selected_model %}selected{% endif %}>{{model}}</option>
        {% endfor %}
    </select>
    <p>Year: </p>
    <input type="text" name="year">
    <p>Km driven: </p>
    <input type="text" name="km">
    <input type="submit">
</form>
{% if price != 0 %}
    <h2>Price: {{ price }}</h2>
{% endif %}

<script>
    // Update the models based on which car you have selected
    document.getElementById('brandSelect').addEventListener('change', function() {
        document.getElementById('carForm').submit();
    });

    // Check so we have a value for Km and Year field, check also so they are numbers
    function validateForm() {
        const kmInput = document.getElementById('kmInput');
        const yearInput = document.getElementById('yearInput');

        if (!isNumeric(kmInput.value) || !isNumeric(yearInput.value)) {
            alert('Please enter numeric values for "km" and "year" fields.');
            return false;
        }

        return true;
    }

    function isNumeric(value) {
        return /^\d+$/.test(value);
    }
</script>
</body>
</html>
To obtain data from the server, we create a function called "get_price." Within this function, we transform the incoming data using the same data transformation techniques employed during the training phase. Subsequently, we utilize the trained AI model to predict a price based on the Brand, Model, Year, and Km variables. Here is the script for this process:
from flask import Flask, render_template, request
from os import path
import pandas as pd
import numpy as np
from sklearn.preprocessing import PolynomialFeatures

# paths
paths = {
    "model": path.join(path.dirname(__file__),"trained.model"),
}

# Helper dictionary
orginal_new_car = {"Year": 0, "Km": 0, "mercedes-benz": 0, "volvo": 0, "a": 0, "c": 0, "e": 0, "glc":0, "s60": 0, "sprinter":0, "v60": 0,  "v70": 0, "v90": 0, "vito":0, "xc40":0,"xc60":0, "Price": 0}

# It is about transforming a value to log 1 plus of it.
def _get_log1p(val):
    log_val = np.log1p(val)
    # return the transformed value
    return log_val

# Transform the data into dictonary that the AI will understand
def get_preperaded_dataframe(dict):
    new_car_dict = orginal_new_car
    new_car_dict["Year"] =  int(dict["Year"])
    new_car_dict["Km"] =  int(dict["Km"])
    new_car_dict[dict["Model"]] = 1
    new_car_dict[dict["Brand"]] = 1

    return new_car_dict

def get_price(dict):
    new_car_dict = get_preperaded_dataframe(dict)
    df = pd.DataFrame([new_car_dict])
     # define a new dataframe called df_features. It should be equal to the df, but without the target (price)
    df_features= df.drop("Price",1)
    # for each column of df_features, create a new column for the log 1 plus transfomed variable
    for col in df_features.columns:
        # Use .apply() method of the column (df[col]), and give it the function defined above (_get_log1p). With that, create a new column in df and call it log1p_{the column name}
        df[f"log1p_{col}"] = df[col].apply(_get_log1p)
    # Define an instance of PolynomialFeatures from the package sklearn
    pn = PolynomialFeatures(2, include_bias=False)
    # Create transfomed data using PolynomialFeatures instance
    trans_data = pn.fit_transform(df_features)
    # Use the trans_data to create a new pandas dataframe
    df_trans = pd.DataFrame(data=trans_data, columns=pn.get_feature_names_out(df_features.columns))
    #
    #df_trans["Price"] = df["Price"]
    # redefine and replace df with df_trans
    df = df_trans
    # get the model using pickle: use with open() as f, give it path of model, and "rb" to read binary. Under with open, define the model variable by calling load() of pickle package. that should take the opened file (f). Replace the next line
    with open(paths["model"], "rb") as f:
        model = pd.read_pickle(f)

    # getting the predicted price by calling predict of loaded model
    predicted_price = model.predict(df)[0]
    predicted_price_rounded = round(predicted_price,0)
    return predicted_price_rounded
Final result
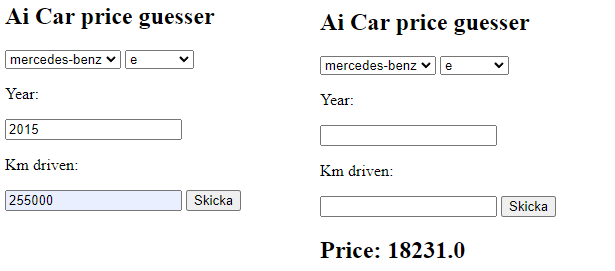
The result is a Flask server capable of predicting car prices with a reasonably high level of accuracy when provided with the brand, model, year, and kilometer driven. However, it's important to note that the predictions cannot be 100% accurate due to factors such as inflated prices or potential issues with the car. Based on my testing, the AI model typically deviates by around 5-10% from the price mentioned in the advertisement. It performs particularly well in predicting cars within the mid-level price range of 5000-20000 €. However, the accuracy may be lower or higher for cars at the lower and higher ends of the price spectrum.
I hope you found this blog post enjoyable! It was a fascinating project that utilized an RPA approach to web scraping, which is not commonly seen. There are numerous areas in this project that can be further improved and expanded upon. For instance, you could enhance the collected data by including additional information about the cars, such as horsepower, transmission type, or fuel type. Furthermore, you could leverage Python's capabilities to analyze the textual data and determine if it conveys positive or negative sentiments.
In terms of web scraping, there may be opportunities to optimize the program's runtime. As we mentioned, it took around 20 hours to complete the entire program. I encourage you to explore potential areas for efficiency gains to speed up the process.
Lastly, in the AI training phase, you could experiment with different parameters and algorithms to further enhance the AI model's performance. There is room for exploration and fine-tuning to achieve even better results.
Overall, this project offers plenty of possibilities for future enhancements and refinements. Feel free to explore these areas and continue improving upon this foundation.
Share